
guides
Choose AI Session Replay Tools That Find Repeatable Issues
Compare AI session replay tools by cross-session analysis, evidence, prioritization, privacy, integrations, and the work they save your team.
•7 min read
Insights, tutorials, and updates from the Flowsery team
Compare AI session replay tools by cross-session analysis, evidence, prioritization, privacy, integrations, and the work they save your team.
Every Google Analytics alternative here is compared on privacy, pricing, dashboard depth, hosting, funnels and revenue tracking, with free tiers noted.


Law, browser blocking and plain data quality now push the same way: privacy-first data tracking without cookies or profiles, and what it will never do.
Every call a Meta Muse connector for analytics reporting makes is a GET, so the weekly report never writes. Which calls it needs, and what it gets wrong.


Build a Meta Muse connector for session analysis from the Flowsery API. GET /issues ranks the problems, and only PATCH /issues/{issueId} writes anything back.
Build a Meta Muse connector for web analytics from the Flowsery API reference. What to paste, which calls are safe, and why Muse visits look human.
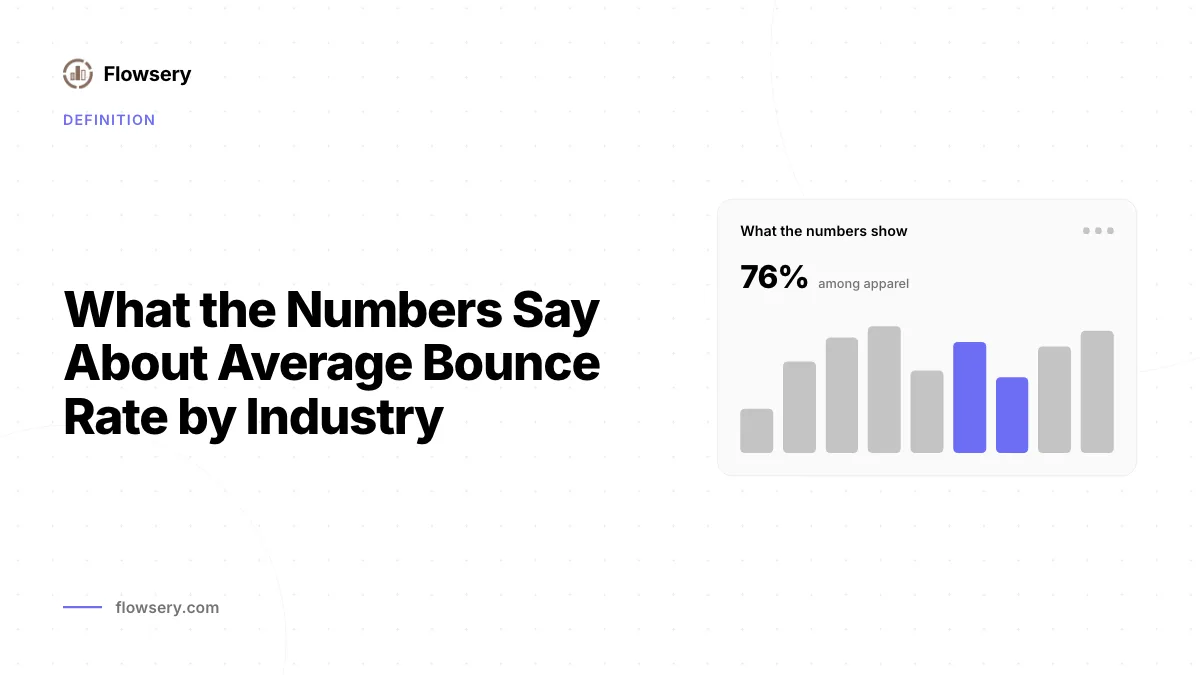

Nine tracked industries return a documented average bounce rate by industry ranging from 35.76% to 48.38%, sourced from Databox data dated September 2024.
The average order value formula divides revenue by orders, and a single discount code or return policy can quietly distort every number a team reports.
Databox's own data puts average session duration benchmarks at 77.61 seconds for B2B sites and 92.33 seconds for B2C sites, split by industry and device too.
In classic analytics, average session duration gives zero recorded time to the very last pageview of every session, which quietly drags the average down.
Comparing beforeunload vs pagehide shows why mobile skips beforeunload, blocks the back-forward cache, and why pagehide with sendBeacon flushes data reliably.
Unlike a raw pageview count, behavioral analytics records what a visitor actually does on a page, as a stream of named events tied to that specific visitor.


A combination of canvas rendering, installed fonts, screen size and timezone is what browser fingerprinting turns into an identifier that survives deletion.

A bug report template names every field a reviewer expects, from steps to reproduce to severity, so incomplete tickets get rejected before an engineer looks.


A recurring meeting called bug triage classifies new reports by severity, assigns each one an owner, and keeps that process separate from backlog grooming.


Roughly seven in ten online carts never turn into an order, and the cart abandonment rate formula shows how much revenue that gap represents in a given month.


A retention curve only makes sense once cohort analysis groups users by a shared start date, since one average hides the pattern a cohort table reveals.

Step conversion and overall conversion answer different questions about a conversion funnel, and the gap between them shows exactly where drop-off happens.


The CPRA amended the CCPA in 2023, adding sensitive personal information rules, a right to correct data, and a dedicated enforcement agency, the CPPA.

The customer acquisition cost formula divides total sales and marketing spend by new customers won, and the numerator decides if that number means anything.
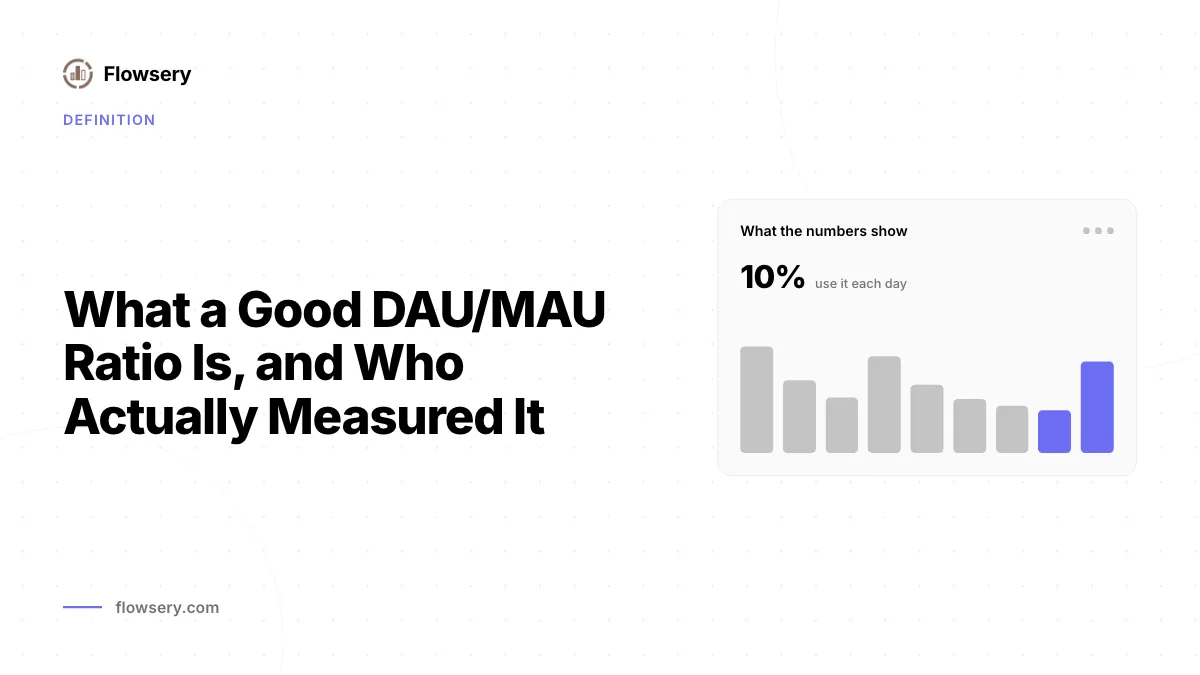

Every DAU/MAU ratio benchmark in circulation traces back to three sources: Fred Wilson in 2011, an undated Gainsight guide, and Mixpanel's June 2026 report.


Unlike event counting, digital experience analytics reconstructs the visit itself, using session replay, heatmaps, friction detection and journey analysis.
Sessions land in direct traffic when no referrer and no campaign tag survive the hop. The real causes: referrer policies, apps, PDFs, redirects, QR codes.


Every funnel produces two drop-off rate numbers, one per step and one end to end, and teams quote them interchangeably. A worked table separates them.
Search engines own dwell time and your analytics cannot see it. Where the line falls against time on page and session duration, and what Google documents.
In product analytics, event tracking records named user actions with properties attached, which turns page-level traffic into a record of what people did.


Three setup choices decide what funnel analysis reports: step sequencing, the conversion window, and whether the funnel counts users or sessions.
Most published funnel drop-off benchmarks average companies that define steps differently, so the numbers rarely transfer. Every figure here is sourced.


One net revenue retention formula, five defensible variants: the same cohort returns 84.0%, 104.5%, 108.3%, 109.5% or 110.3% depending on window and base.


Before launching a test, a/b test sample size determines whether the result you see is signal or noise, and the formula needs three numbers set in advance.


Move the attribution window from 7 to 90 days and one $1,800 order pays three different sets of channels. See the arithmetic and the current platform defaults.


In product analytics, autocapture records every click, page view and form submit automatically, without a single tracking call written by hand.
Reading bounce rate vs exit rate comes down to two denominators. One pricing page returns a 40% exit rate and a 15% bounce rate in the same week.

One churn rate formula, three defensible denominators: the same month of data returns 3.70%, 4.00% and 6.00% depending on what you agree to divide by.
The conversion rate formula is conversions divided by sessions or unique visitors, times 100. One week of traffic run through both denominators gives two.


Every Cumulative Layout Shift score is impact fraction times distance fraction, and Google reports the largest burst of shifts, not the sum of them.
The GDPR test for data controller vs data processor is who determines the purposes and means. What each role signs, owes, and does when a breach hits.
GA4 reports engagement rate as engaged sessions divided by total sessions. A session counts as engaged at 10 seconds, one key event, or two page views.

The split between first-party vs third-party cookies is the domain that set them, not who wrote them. What browsers block now, and what breaks when they do.


The four frustration signals are rage clicks, dead clicks, error clicks and thrashed cursors. Each one fires on a threshold your tool sets, not on a guess.


Chrome scores Interaction to Next Paint on a page's worst interaction, timing input delay, processing and presentation delay to the next painted frame.


Scored good at 2.5 seconds or less, Largest Contentful Paint splits into four subparts, and the split is what tells you which one is costing you the seconds.
Credit for one conversion depends on the marketing attribution model you pick. See seven models split the same four-touch journey, with exact percentages.


The MRR meaning covers new, expansion, contraction and churned revenue each month, and excludes one-time fees that never repeat.
Comparing pageviews vs sessions vs users shows three separate counts that roll up into each other and rarely land on the same number twice.

Unlike web analytics, product analytics measures behavior event by event and user by user, so you can answer activation, retention and funnel questions.


Passive by design, real user monitoring collects performance and error data from visits that really happened, then reports it at p75 instead of an average.
The retention rate formula divides retained customers by the customers you started with, and miscounting new signups skews the result every time.


Apple's Safari 7 day cookie limit caps script-set first-party cookies, and a shorter 24 hour cap applies after certain cross-site link clicks.
A session timeout closes an idle visitor's session, and the default 30-minute rule is why the same traffic reports different counts.


A good bug report writes steps to reproduce as numbered actions from a known starting point, so anyone on the team can trigger the same failure.


A plain definition of web analytics, what a tracking script collects, the core metrics and how each one gets misread, and where product analytics takes over.

The phrase website heatmap covers five overlays: click, scroll, move, confetti and attention. Here is what each one measures and where each one misleads.