
TL;DR, Quick Answer
15 min readFive categories of data analytics platform charge in five different ways: per session, per event, per seat, per capacity unit, and per byte scanned. Pick the category that matches your question first, then check which meter you are buying. Verified pricing for Flowsery, Amplitude, Mixpanel, PostHog, Power BI, Tableau, Metabase, Looker, Alteryx, BigQuery, Redshift, Snowflake and Databricks, checked August 22, 2026.
Buy the wrong category among the top data analytics platforms and the cost shows up months later, when the dashboard cannot answer the question you bought it for.
The mistake is rarely picking a bad product. It is comparing a website analytics tool, a product analytics platform, a BI suite, a data-prep tool, and a cloud warehouse as though they were interchangeable. They measure different things, they are used by different people, and they charge on five completely different meters.
This guide covers all five categories with prices taken from vendor pages, not from roundups. Where a vendor hides its number behind a sales call, I say so instead of guessing.
Research checked: August 22, 2026. SaaS pricing changes often, so confirm the final quote before signing. Every figure below comes from an official pricing page, official documentation, or a court judgment, each linked at the point it is used.
Quick comparison
| Platform | Category | Entry price (verified Aug 2026) | What you are billed for | Main caution |
|---|---|---|---|---|
| Flowsery | Privacy-first web analytics | From $250/mo, 14-day trial | Analytics sessions | No free plan, no self-hosting |
| Amplitude | Product analytics | Free to 2M events/mo | Events | Growth and Enterprise rates are sales-led |
| Mixpanel | Product analytics | Free to 1M events/mo | Events | Needs a disciplined event taxonomy |
| PostHog | Product analytics | Free to 1M events/mo | Events, per product | Bill splits across many separate products |
| Microsoft Power BI | BI | $14/user/mo (Pro) | Seats, or Fabric capacity | Below F64 every viewer still needs a paid seat |
| Tableau | BI | $15/user/mo (Viewer) | Seats, or viewer capacity blocks | The $15 headline is a Viewer, a Creator is $75 |
| Metabase | BI | Free self-hosted, $100/mo cloud | Base fee plus seats | Embedded viewers count as billable users |
| Looker | BI | Sales-led only | Instances plus user tiers | Google publishes no list price at all |
| Alteryx | Data prep | $250/user/mo, 1 to 10 users | Seats plus automation runs | Starter is cloud-only, capped at 50 runs |
| Google BigQuery | Cloud warehouse | $6.25/TiB scanned, 1 TiB free | Bytes scanned, or slot-hours | A careless SELECT * is a billable event |
| Amazon Redshift | Cloud warehouse | $0.375/RPU-hour | RPU-hours while queries run | Default base capacity is 128 RPUs |
| Snowflake | Cloud warehouse | Consumption credits, no list price | Credits plus storage | Rates vary by edition, cloud and region |
| Databricks | Lakehouse | $0.70/DBU (SQL Serverless, AWS) | DBUs | Classic and Pro add cloud VM cost on top |
The five meters, and why they matter more than features
Feature lists converge. Billing models do not. Before comparing dashboards, work out which of these five meters a vendor has pointed at you, because that decides whether your bill grows with your team, your traffic, or your carelessness.
Per session or pageview. Website analytics. Cost tracks marketing success. Predictable, and it stays flat as headcount grows.
Per event. Product analytics. Cost tracks instrumentation decisions, not business value. An engineer who adds tracking to a scroll handler can double the bill without anyone deciding to spend more.
Per seat. BI and data prep. Cost tracks how many people you let look. This is the meter that quietly punishes the thing you actually want, which is more people reading the numbers.
Per capacity unit. Fabric F SKUs, Tableau viewer blocks. You buy a fixed block of compute or access and stop paying per head. Expensive until you are large, then much cheaper.
Per byte scanned or per compute-second. Cloud warehouses. Cost tracks query hygiene. A single unpartitioned table can cost more than the entire BI tool sitting on top of it.
A team that understands which meter it bought makes better decisions than a team that read every feature matrix. The rest of this guide applies that lens to each platform.
1. Privacy-first web analytics
Use this category when the questions are about a public website: how many people visited, where they came from, which pages and campaigns converted, which content performs, and which countries or devices deserve attention.
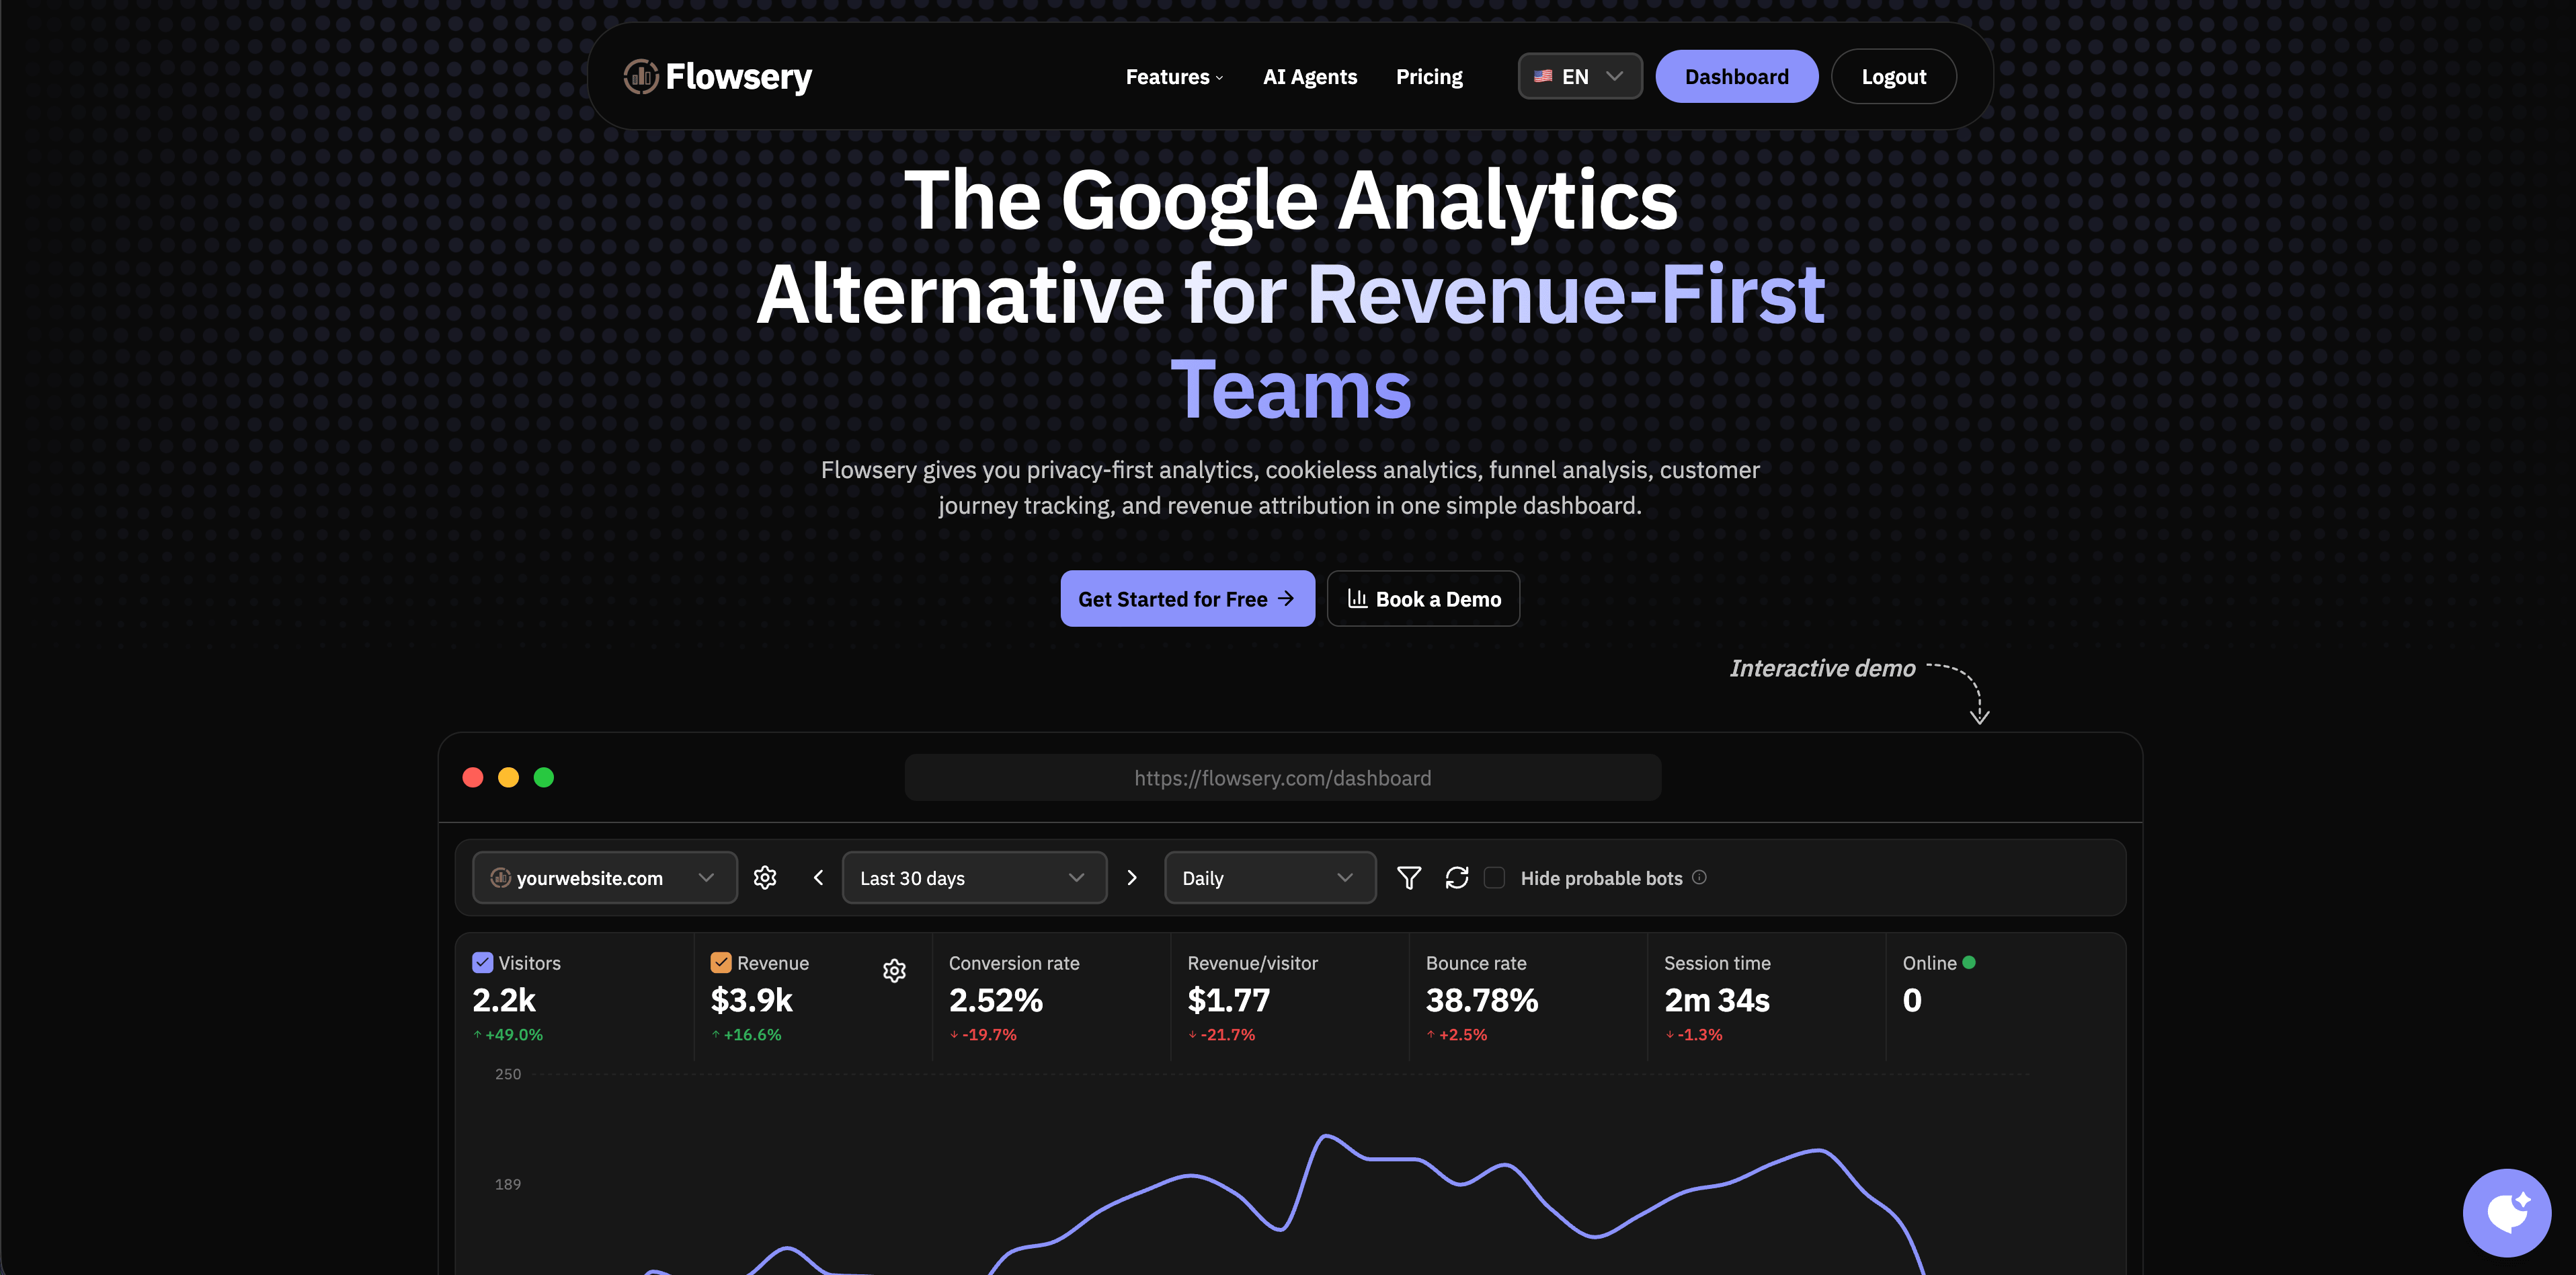
Flowsery sits here. Its pricing page lists Team at $250 per month and Pro at $500 per month, with Pro covering 1M analytics sessions, with usage billed past that and no hard cap, plus a 14-day free trial with no credit card. Pro includes unlimited websites, up to 10 team members, 3-year retention, goals, funnels, revenue tracking, custom events, session recordings, full API access, and cookie-free tracking with no sampling.
What to look for across the category, whichever vendor you pick: no cookies, no full IP storage, no cross-site tracking, a small script, goal and funnel reporting, UTM breakdowns, exports, and processing terms you can hand to a lawyer without embarrassment.

Flowsery
Start Your 14-Day Free Trial
Real-time dashboard
Goal tracking
Cookie-free tracking
The honest limits: Flowsery has no free tier and no self-hosted edition, so a hard self-hosting requirement rules it out. And no tool in this category replaces deep in-app behavioral analysis or warehouse-scale reporting. It is not supposed to.
If you are shortlisting inside this category rather than across categories, the 12 Google Analytics alternatives comparison covers Plausible, Fathom, Simple Analytics, Pirsch, Matomo, Umami and the rest with the same pricing discipline.
2. Amplitude
Amplitude is built for product analytics: events, funnels, cohorts, retention, experimentation, guides, surveys, session replay, and activation.
Its pricing page currently lists four plans, and none of them is called Starter. Free gives 2M events per month with no time limit, no credit card, unlimited seats, and 10K monthly session replays. Plus starts at $0, keeps the first 2M events free, scales to 70M events per month, and carries 2-year data retention. Growth and Enterprise are both custom, priced on event volume, and Growth is where SSO and project permissions start. Startups with fewer than 20 employees and under $10M raised can apply for one free year of Growth.
Choose Amplitude when product teams need to understand feature adoption, onboarding, retention, and paths inside a logged-in app.
Two cautions. The first is event design: product analytics becomes unusable or invasive when teams instrument every click, push personal data into event properties, or skip retention and access rules. The second is the pricing cliff. Free and Plus are genuinely generous, but the moment you need SSO, project permissions, or advanced exploration, you are in a sales conversation with no published rate to anchor against.
3. Mixpanel and PostHog
Both compete with Amplitude on the same meter, and both publish more of their numbers.
Mixpanel's pricing page lists a free plan up to 1M events per month with 10K monthly session replays, a Growth plan starting at $0 that scales to 20M events per month, and Enterprise reaching 1T events per month. Companies under five years old with $8M or less raised get their first year free.
PostHog's pricing page gives 1M product analytics events and 5K session replay recordings free each month, with product analytics starting at $0.00005 per event after that and the rate stepping down at higher volume. PostHog bills each product separately, which makes small starts cheap and full-suite adoption harder to forecast.
Pick Mixpanel when you want a mature analysis surface and clean funnel, cohort and retention work. Pick PostHog when engineering wants analytics, replay, flags and experiments in one place and will accept a broader data footprint to get it.

4. Microsoft Power BI
Power BI covers dashboards, reports, semantic models, and everything that touches the Microsoft stack.
Microsoft raised Power BI prices in April 2025, the first increase in roughly a decade. Per the official pricing page, Pro is $14 per user per month billed yearly, with a 1 GB model size limit, 8 refreshes a day, and 10 GB storage per license. Premium Per User is $24 per user per month, lifting the model limit to 100 GB and refreshes to 48 a day.
Then there is the part that decides large deployments. Microsoft's licensing documentation is explicit: on Fabric capacities smaller than F64, every user viewing Power BI content needs a Pro, PPU, or trial license. On F64 or larger, users with only a Free license and a viewer role can view content. Azure's pricing page puts F64 at $8,409.60 per month pay-as-you-go, or $5,002.667 per month on a reservation, roughly 41% less. The smallest SKU, F2, is $262.80 per month pay-as-you-go.
That gives a break-even worth calculating before anyone signs. Removing the $14 Pro requirement for viewers only pays for itself at about 601 viewers against pay-as-you-go F64, or about 358 viewers against the reserved price. Report publishers still need Pro either way. The capacity also buys compute you would otherwise pay for separately, so treat those numbers as the floor of the argument rather than the whole of it.
Flowsery
Start Your 14-Day Free Trial
Real-time dashboard
Goal tracking
Cookie-free tracking
Choose Power BI when teams need to join internal data from finance, sales, operations, product, and support, and when the organization already lives in Microsoft 365. Plan for data modeling skill. BI fails when every report defines revenue differently.
5. Tableau
Tableau is strong for interactive visual analytics, governed dashboards, and enterprise reporting. Salesforce restructured its packaging into Standard, Enterprise and Cloud+ editions, which makes the headline price easy to misread.
The Tableau Cloud pricing page advertises "starting at $15 per user per month." That $15 is a Viewer seat. The Creator seat that actually builds anything is $75 per user per month on Standard. Explorer sits between them at $42. On Enterprise Edition the same three roles cost $115, $70 and $35. Every deployment needs at least one Creator, all plans require an annual contract, and Tableau states plainly that monthly plans are not available.
Work an example. A team of 10 Creators, 5 Explorers and 100 Viewers costs $2,460 per month on Standard, which is $29,520 a year. The identical team on Enterprise Edition costs $5,000 per month, or $60,000 a year. Same people, same dashboards, roughly double the invoice, and the difference is Data Management, Advanced Management, eLearning and a higher site count.
Tableau now also offers capacity-based pricing, where you buy Creator and Explorer seats plus Viewer blocks instead of individual viewer licenses. Its FAQ notes that capacity-based and role-based viewer licensing cannot be mixed in one tenant, and neither can editions. Decide before you deploy, not after.
Choose Tableau when analysts need flexible visual exploration across complex data and the organization can fund governance, training, and administration. Watch the total: seats, add-ons, data management, support, and implementation services routinely exceed the headline license.
6. Metabase and Looker
Two BI options that sit either side of Tableau and Power BI on cost and openness.
Metabase publishes everything. Its pricing page lists a free open-source edition with unlimited users, a Starter plan at $100 per month including 5 users then $6 per additional user, and Pro at $575 per month including 10 users then $12 per additional user. Enterprise starts around $20,000 a year. One detail catches teams out: billable users include embedded viewers, not only staff.
Looker publishes nothing. Google's Looker pricing page describes Standard, Enterprise and Embed editions, each bundling one production instance with 10 Standard Users and 2 Developer Users, and then says to call sales for every one of them. That opacity is itself a selection criterion. If you need a number for a budget cycle before you can justify a procurement conversation, Looker will not give you one.
Metabase is the pragmatic choice for a team that wants SQL-backed dashboards without a licensing project. Looker is for organizations that want a governed semantic model in LookML and have the patience and budget for an enterprise sale.
7. Alteryx
Alteryx handles data preparation, blending, automation, and analytics workflows for people who do not want to write the pipeline from scratch.
Its pricing page lists Starter Edition at $250 per user per month billed annually, limited to 1 to 10 basic users, cloud-only deployment, file-based connectivity, and 50 automation runs included. Professional and Enterprise are both sales-led. Professional adds desktop plus cloud, 100+ connectors, and 15,000 runs. Enterprise adds governance, analytic apps, and free viewer licenses. There is a 30-day free trial.
Worth knowing who you are buying from: Clearlake Capital and Insight Partners completed their $4.4 billion take-private of Alteryx in March 2024. Private equity ownership does not make a product worse, but it does make packaging and pricing more likely to move, which is a reason to keep contract terms short.
Choose Alteryx when repeatable workflows to clean, join, transform and analyse data from many sources are the actual job. Do not choose it to produce traffic and conversion reports. At $250 a seat, that is an expensive way to count pageviews.

Flowsery
Start Your 14-Day Free Trial
Real-time dashboard
Goal tracking
Cookie-free tracking
8. Cloud data platforms
When the question is "how do revenue, usage, support and churn connect," the answer lives in a warehouse rather than in any analytics product. These four charge on compute, and their defaults deserve attention.
BigQuery. Google's pricing is $6.25 per TiB scanned on demand, with the first 1 TiB per month free and active storage at about $23.55 per TiB per month. Capacity pricing runs $0.04 per slot-hour on Standard edition, $0.06 on Enterprise, and $0.10 on Enterprise Plus, in us-central1. Scanning 20 TiB in a month costs $118.75 on demand. A steady 100-slot Standard reservation costs roughly $2,920 a month, which only beats on-demand past about 468 TiB scanned. Most teams should stay on demand far longer than they assume.
Amazon Redshift. Serverless is $0.375 per RPU-hour with per-second billing and a 60-second minimum. One RPU gives 16 GB of memory. The number to check on day one is in AWS documentation: the default base capacity is 128 RPUs, adjustable from 4 to 512, and 128 RPUs is $48 for every hour of query time. Compute stops when queries stop, so this is a bill driven by workload rather than by the clock, but the default is sized for a much larger shop than most teams running their first workgroup.
Snowflake. Consumption-based, billed in credits against Standard, Enterprise, Business Critical or VPS editions, plus storage. Snowflake's pricing page does not publish a per-credit rate on the page itself, and the effective rate depends on edition, cloud provider, region, and whether you buy on demand or prepay capacity. Get the credit rate in writing for your specific region before modelling anything.
Databricks. SQL pricing on AWS is $0.22 per DBU for SQL Classic, $0.55 for SQL Pro, and $0.70 for SQL Serverless. Serverless includes the cloud instance cost. Classic and Pro do not, so those two rates sit on top of an EC2 bill that is easy to leave out of a comparison.
Three questions that settle most decisions
Long selection frameworks rarely survive contact with a real procurement deadline. These three do most of the work.
Where does the data start? A website, an app's events, an internal database, or a pile of messy files. That single answer usually eliminates three of the five categories immediately.
Who has to read the answer? Marketers and executives need a dashboard someone else maintains. Analysts need exploration. Engineers need an API and a query interface. Buying an analyst tool for executives produces expensive unread dashboards.
Which meter can you afford to be wrong about? If your traffic might spike 10x, avoid per-session and per-event pricing without a cap. If your headcount might double, avoid per-seat. If your SQL is written by people learning SQL, avoid per-byte-scanned until you have partitioning and a cost guardrail.
Then the operational questions, which matter at signing rather than at shortlisting: what is the source of truth for revenue and customer status, who governs metric definitions, is regional hosting required, and what does this cost at the volume you expect in 18 months rather than today.
Privacy and governance checklist
For any platform, review the data collected, the personal and sensitive data risk, the vendor's role and DPA, the subprocessor list, the hosting region, retention controls, access controls, audit logs, export and deletion support, and whether your data feeds vendor advertising or model training.
Data residency deserves a specific note in 2026. The EU-US Data Privacy Framework remains the legal basis most US analytics vendors rely on for EU personal data, and it survived its first court test: the General Court dismissed Philippe Latombe's annulment action in case T-553/23 on September 3, 2025, finding that the US ensures an adequate level of protection. That judgment has been appealed to the Court of Justice. Two earlier transfer frameworks were struck down on appeal, so treating the current one as permanently settled is a bet, not a fact. Teams that would find a third invalidation expensive should prefer vendors with EU hosting or a self-hosted option, and should document that choice now rather than during a fire drill.
A powerful platform can still be the wrong choice if it creates privacy debt or metric confusion. Start with the decision, buy the smallest capable tool, and add to the stack when there is an operational need rather than an interesting demo.
A stack that stays honest
Most teams do not need one platform to do everything. A clean separation looks like this:
- Privacy-first web analytics for the public website and campaigns.
- Product events for activation and retention inside the app.
- CRM for the sales pipeline.
- The payment platform as the source of truth for revenue.
- BI only once leadership needs those sources joined in one report.
Each system stays accountable for one thing. More usefully, it stops marketing tags from quietly becoming the system of record for customers, revenue, or regulated data, which is the failure mode that turns an analytics decision into a legal one.
Flowsery
Start Your 14-Day Free Trial
Real-time dashboard
Goal tracking
Cookie-free tracking
Frequently asked questions
Which data analytics platform is best overall?
There is no overall winner, because the five categories answer different questions. For website and campaign measurement, start with privacy-first web analytics such as Flowsery. For in-app behavior, use Amplitude, Mixpanel or PostHog. For joined internal reporting, use Power BI, Tableau or Metabase. For repeatable data preparation, use Alteryx. For anything warehouse-scale, use BigQuery, Redshift, Snowflake or Databricks with a BI layer on top.
What is the cheapest way to start?
Free tiers are real in product analytics and warehousing, and mostly absent in BI and data prep. Amplitude gives 2M events a month forever, Mixpanel and PostHog give 1M events a month, BigQuery gives 1 TiB of query per month plus 10 GiB of storage, and Metabase's open-source edition is free for unlimited users if you host it. Tableau, Alteryx and Flowsery all run on trials rather than free plans.
Why is Tableau advertised at $15 when people say it costs much more?
Because $15 is a Viewer seat, and a Viewer cannot build anything. A Creator is $75 per user per month on Standard Edition and $115 on Enterprise Edition, every deployment needs at least one Creator, and contracts are annual. The advertised number is real, it just describes the cheapest possible person in the deployment.
When does Microsoft Fabric capacity beat buying Power BI Pro seats?
Roughly past 600 viewers at the pay-as-you-go F64 price of $8,409.60 a month, or past about 358 viewers at the reserved price of $5,002.667 a month. F64 is the point at which free licenses can view content. Below F64, every viewer still needs a $14 Pro seat regardless of capacity size, and publishers need Pro at any size.
How do I compare platforms with completely different pricing models?
Model 18 months out, not today, and convert every vendor to one number: total cost at your expected volume, plus the seats needed for everyone who must read the result. A per-event tool looks cheap next to a per-seat tool until instrumentation grows, and a per-seat tool looks cheap until the viewer count does. Then ask what happens when you exceed a limit, because the difference between usage-based billing, a hard cap, and a forced upgrade to a sales-led tier is the difference between a small surprise and a renegotiation.
Do I need a data warehouse at all?
Not until a question genuinely spans systems. If every question you have can be answered inside one product's dashboard, adding a warehouse adds cost, latency, and a pipeline to maintain. The trigger is a question like "which acquisition channels produce customers who stay 12 months," which no single tool holds all the data for.
How much does PostHog cost after the free tier?
PostHog gives 1M product analytics events and 5K session replay recordings free each month. After that, product analytics starts at $0.00005 per event, with the rate stepping down at higher volume. PostHog also bills each product separately, so a small start is cheap but forecasting a full-suite bill takes more work.
Who owns Alteryx, and does that affect pricing?
Clearlake Capital and Insight Partners completed a $4.4 billion take-private of Alteryx in March 2024. Private equity ownership does not make a product worse, but it does put packaging and pricing in play. That is a reason to keep Alteryx contract terms short.
Does Snowflake publish a price per credit?
Snowflake's pricing page does not list a per-credit rate. Billing runs on consumption credits against the Standard, Enterprise, Business Critical or VPS edition plus storage, and the effective rate depends on edition, cloud provider, region, and whether you buy on demand or prepay capacity. Get the credit rate in writing for your specific region before modeling any cost.
What is the default base capacity for Amazon Redshift Serverless?
The default base capacity is 128 RPUs, adjustable from 4 to 512, at $0.375 per RPU-hour. At the default setting that is $48 for every hour queries run, sized for a much larger shop than most teams running their first workgroup. Compute stops when queries stop, so check the default before the first bill arrives.
What to verify before you sign
Match the platform to the decision. Use privacy-first web analytics for site and campaign questions, product analytics for logged-in feature behavior, BI for governed internal reporting, data prep for messy multi-source workflows, and a cloud warehouse only when questions cross systems. Do not buy a broad platform to answer a narrow page-performance question.
For each vendor on the shortlist, confirm current pricing, which meter you are on and what happens when you exceed it, data residency, access controls, the sharing model, AI and model-training terms, the export path, and the admin burden. Write down the date you checked. Packaging in this category changed materially in the last 18 months, and the numbers above will need rechecking too.
Start with Flowsery for free and measure traffic, goals, funnels, and revenue attribution without a licensing project attached.
Sources: Flowsery, Amplitude, Mixpanel, PostHog, Microsoft Power BI and Azure Fabric, Microsoft Fabric licensing documentation, Tableau Cloud, Metabase, Google Looker, Google BigQuery, Alteryx and Databricks pricing pages; AWS Redshift pricing and Redshift Serverless capacity documentation; Snowflake pricing options; Alteryx press release on the completed Clearlake and Insight Partners acquisition; IAPP reporting on General Court case T-553/23. All checked August 22, 2026.
Was This Article Helpful?
Let us know what you think!
See us more often in Google
One click marks Flowsery as a preferred source, so our articles sit higher in your Top Stories, AI Mode, and AI Overviews.
Before you go...
Flowsery
Revenue-first analytics for your website
Track every visitor, source, and conversion in real time. Simple, powerful, and cookie-free.
Real-time dashboard
Goal tracking
Cookie-free tracking
Related Articles
Useful Context - Best Business Analytics Software for Beginners
Looking for the best business analytics software for beginners? Compare Tableau, Power BI, Looker Studio, Domo, Sisense and Zoho by setup effort and cost.


Key Insights - Privacy-Focused Analytics
GA4 against privacy-compliant event tracking solutions worldwide: event limits, parameter caps, retention windows, and how much identity each one attaches.
Useful Context - Google Closest Competitors Privacy Data Protection
Search, mail, storage, maps and analytics all have privacy-respecting replacements. Which swaps pay off first, and a migration order that avoids chaos.