
TL;DR, Quick Answer
6 min readThe retention rate formula is (E - N) / S times 100, where S is customers at the start of a period, N is new customers added during it, and E is customers at the end. Dropping the minus-N step is the most common miscount and inflates the result into a growth number instead of a retention number. Revenue retention runs the same logic on MRR instead of headcount.
What is the retention rate formula?
The retention rate formula that customer success and finance teams both use is (E - N) / S multiplied by 100, where E is the number of customers active at the end of the period, N is the number of new customers added during it, and S is the number of customers active at the start. The formula measures one thing only: what share of the customers you already had stayed, with every new signup during the period removed from the count before the division happens.
retention rate = ((E - N) / S) x 100Reading the formula in words matters more than memorizing the letters. S is the base you are testing loyalty against. N is excluded because a brand-new customer cannot have been retained; they were never at risk of leaving in the first place. E minus N gives you the count of original customers who are still around, and dividing that by S turns it into a rate.
How do you work the (E-N)/S formula on real numbers?
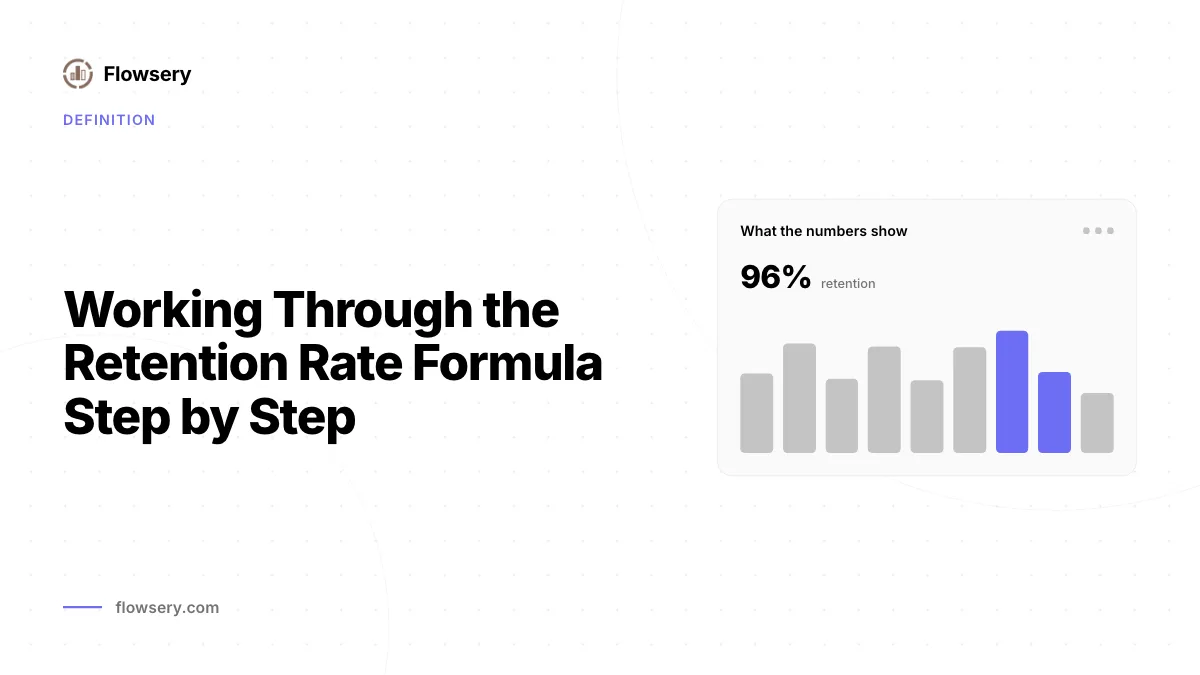
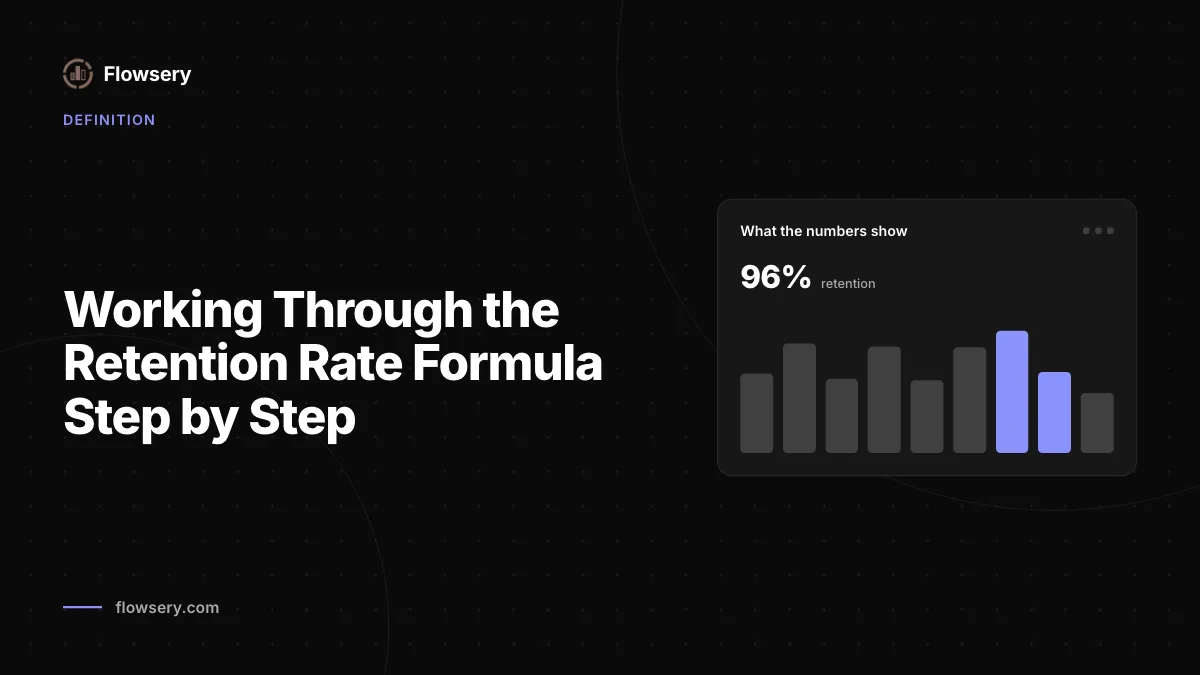
Work one quarter end to end. A company starts Q1 with 1,000 customers, so S = 1,000. During the quarter, 120 new customers sign up, so N = 120. The quarter closes with 1,080 total active customers, so E = 1,080.
retention rate = ((1,080 - 120) / 1,000) x 100 = (960 / 1,000) x 100 = 96%| Variable | Meaning | Value |
|---|---|---|
| S | Customers at the start of Q1 | 1,000 |
| N | New customers added during Q1 | 120 |
| E | Customers at the end of Q1 | 1,080 |
| E - N | Original customers still active | 960 |
| Retention rate | (E - N) / S x 100 | 96% |
96% retention means 960 of the original 1,000 customers stayed, and the other 40 canceled, which lines up with a 4% churn rate on that same base since retention and churn are two readings of the same movement.
What is the most common miscount in the retention rate formula?
The most common miscount skips subtracting N and divides E directly by S, which measures growth instead of retention. Run the same Q1 numbers without removing the new signups: 1,080 / 1,000 x 100 = 108%. That figure looks like an improvement, but it is a growth rate that mixes new business with the customers you already had, and it can sit above 100% even in a quarter where every single original customer churned and was replaced by more new signups than were lost.
The fix is the same every time: pull N out of E before dividing. A retention rate above 100% is possible only on the revenue side, where expansion revenue from surviving customers can outweigh what churned; a customer-count retention rate is capped at 100%, and any calculation that exceeds it has skipped the minus-N step.

- 1,080 - 120 = 960
- 960 / 1,000 x 100 = 96% retention
- The 120 new signups stay mixed into E
- 1,080 / 1,000 x 100 = 108% growth, not retention
What is the difference between customer retention and revenue retention?
Customer retention counts logos and revenue retention counts money, so they diverge whenever the customers who leave are not the same size as the customers who expand. A company can hold 96% customer retention while losing more revenue than that if the accounts that churned were larger than average, or gain revenue above 100% if the customers who stayed spent more even as some smaller accounts left. Track both, because a headline retention percentage on customers alone hides which dollars actually walked out the door.
Flowsery pulls revenue by source directly from Stripe, Paddle, Polar and Lemon Squeezy, so the MRR that revenue retention divides by comes from the billing system instead of a manually reconciled spreadsheet.
What is gross revenue retention vs net revenue retention?
Gross revenue retention subtracts churned and contracted MRR from beginning MRR with no credit for expansion, while net revenue retention adds expansion MRR back in, which lets it exceed 100%.
gross revenue retention = (beginning MRR - churned MRR - contraction MRR) / beginning MRR x 100
net revenue retention   = (beginning MRR - churned MRR - contraction MRR + expansion MRR) / beginning MRR x 100
A company opens the quarter with $100,000 in MRR, loses $6,000 to cancellations and $1,500 to downgrades, and gains $9,000 from expansion. Gross revenue retention is (100,000 - 6,000 - 1,500) / 100,000 x 100 = 92.5%. Net revenue retention is (100,000 - 6,000 - 1,500 + 9,000) / 100,000 x 100 = 101.5%. Quote gross when diagnosing how much revenue is actually at risk, since expansion cannot mask it, and quote net when reporting overall growth from the existing customer base.
What is cohort retention?
Cohort retention tracks the same group of customers, grouped by the month or week they signed up, forward through time to see how their retention rate changes the longer they stay. Instead of one retention number for the whole business in one period, a cohort table shows a separate line for each signup month, so a team can see whether customers who joined in January behave differently from customers who joined in June.
| Cohort | Month 1 | Month 3 | Month 6 | Month 12 |
|---|---|---|---|---|
| January signups | 100% | 88% | 76% | 61% |
| April signups | 100% | 91% | 80% | not yet available |
| July signups | 100% | 93% | not yet available | not yet available |
Reading down a column compares cohorts at the same age, and reading across a row shows one cohort decaying over time. Customer journey tracking and a funnel report segmented by the same cohort explain the drop between two columns, since the retention table shows that a cohort shrank without saying what those customers were doing before they left.

How does retention rate relate to churn rate?
Retention rate and churn rate are complementary readings of the same movement, so retention rate equals 100% minus churn rate when both are calculated on the same base and the same period. Q1's 96% retention and 4% churn add to exactly 100% because they share the same S, N and departure count. The two numbers diverge only when a team calculates them on different denominators, such as retention measured against the opening count and churn measured against a mid-period average, which is why publishing the formula and the base next to either number matters as much as the percentage itself.

Flowsery
Start Your 14-Day Free Trial
Real-time dashboard
Goal tracking
Cookie-free tracking
Frequently Asked Questions
What does the E, N and S stand for in the retention rate formula?
E is the number of customers active at the end of the period, N is the number of new customers added during the period, and S is the number of customers active at the start of the period. The formula is (E - N) / S times 100, and skipping the N subtraction is the single most common error teams make when calculating it.
Why is my retention rate formula giving a number over 100%?
A customer-count retention rate cannot exceed 100%, so a result above it means new customers were not subtracted from E before dividing by S. Revenue retention rate can legitimately exceed 100% when expansion revenue from existing customers outweighs churn and contraction in the same period.
What is a good retention rate?
There is no single retention rate that applies to every business, since acceptable retention depends on contract length, price point and how the period is measured; compare your rate against your own trailing periods and against your own cohorts instead of an outside benchmark. A rate that is falling quarter over quarter on the same measurement method is the signal worth acting on.
How is customer retention rate different from revenue retention rate?
Customer retention rate counts logos and caps at 100%, while revenue retention rate counts dollars and can exceed 100% when expansion revenue from surviving accounts outpaces churn and downgrades. A business can report high customer retention and mediocre revenue retention if the accounts leaving are larger than the accounts staying.
How frequently should cohort retention be recalculated?
Recalculate a cohort's retention rate every time a new period closes, since each cohort accumulates one more data point with every passing month or week it stays active. A cohort table built once and never updated stops answering the question it exists to answer, which is whether retention behavior is improving or worsening for customers who joined more recently.
Can retention rate be negative?
No, customer retention rate cannot go below 0%, since the lowest possible value is when every original customer from S has churned, leaving E - N at zero. Net revenue retention can go below 0% in an extreme case only if downgrades and churn somehow exceed beginning MRR itself, which is not a scenario that occurs in ordinary subscription billing.
Can I calculate retention rate for a month instead of a quarter?
The formula stays (E - N) / S x 100 regardless of the period you pick. The Q1 walkthrough above uses a quarter because that's a common reporting cycle, and the cohort tables apply the same S, N and E logic by month or week instead.
Where does the MRR figure for revenue retention come from?
Flowsery pulls revenue by source directly from Stripe, Paddle, Polar and Lemon Squeezy, so the MRR that feeds gross and net revenue retention comes from the billing system. That replaces the manually reconciled spreadsheet a team would otherwise build the number from.
Can gross revenue retention go above 100%?
No, gross revenue retention subtracts churned and contracted MRR from beginning MRR with no credit for expansion, so it cannot exceed 100%. Net revenue retention runs the same formula but adds expansion MRR back in, which is what lets it climb past 100%.
What does a cohort table show that a single retention number doesn't?
A single retention rate collapses the whole customer base into one percentage for one period. A cohort table gives each signup month its own row, so reading down a column compares cohorts at the same age and reading across a row shows one cohort decaying over time.
Was This Article Helpful?
Let us know what you think!
See us more often in Google
One click marks Flowsery as a preferred source, so our articles sit higher in your Top Stories, AI Mode, and AI Overviews.
Before you go...
Flowsery
Revenue-first analytics for your website
Track every visitor, source, and conversion in real time. Simple, powerful, and cookie-free.
Real-time dashboard
Goal tracking
Cookie-free tracking
Related Glossary Terms


Five Ways to Calculate Net Revenue Retention From One Dataset
One net revenue retention formula, five defensible variants: the same cohort returns 84.0%, 104.5%, 108.3%, 109.5% or 110.3% depending on window and base.


Reading a Retention Curve Starts With Cohort Analysis
A retention curve only makes sense once cohort analysis groups users by a shared start date, since one average hides the pattern a cohort table reveals.


What Behavioral Analytics Tracks That Pageviews Miss
Unlike a raw pageview count, behavioral analytics records what a visitor actually does on a page, as a stream of named events tied to that specific visitor.


What a Good DAU/MAU Ratio Is, and Who Actually Measured It
Every DAU/MAU ratio benchmark in circulation traces back to three sources: Fred Wilson in 2011, an undated Gainsight guide, and Mixpanel's June 2026 report.


Why the Churn Rate Formula Gives Three Different Answers
One churn rate formula, three defensible denominators: the same month of data returns 3.70%, 4.00% and 6.00% depending on what you agree to divide by.


What the MRR Meaning Actually Includes and Excludes
The MRR meaning covers new, expansion, contraction and churned revenue each month, and excludes one-time fees that never repeat.
Related Articles


When Data Sampling Starts and How to Spot It in a Report
In GA4, data sampling starts above 10 million events on standard properties and 100 million on Analytics 360, and one icon is the only on-screen tell.


What Clickstream Data Records, Row by Row
Every clickstream data row is one hit with a timestamp, an identifier and a URL, which is why the GDPR and the CCPA both treat the export as personal data.


Reading Entry Page vs Landing Page in GA4 and Adobe
The entry page vs landing page split matters because GA4 ships only a Landing page dimension and Adobe ships only Entry page, computed from different fields.