
TL;DR, Quick Answer
7 min readWatching random recordings rarely produces decisions. Sample sessions around a goal, read friction signals, group repeated behavior across sessions, and turn each pattern into a ranked issue tied to a funnel step.
Most teams that want to know how to analyze session recordings open the replay list, watch a few videos, feel vaguely informed, and close the tab. The work produces a story but not a decision.
A recording is raw evidence. On its own it shows what one person did on one visit. The analysis that changes a roadmap comes from choosing the right sessions, reading them against a goal, and connecting repeated behavior into something a team can rank and fix.
This guide describes that process in order: sample, read, group, rank.
Start with a question, not the recording list
The fastest way to waste an afternoon is to watch sessions at random. Recordings are only useful against a specific question, because the question decides which sessions belong in the sample and what counts as a finding.
Pick one of these and commit before you press play:
- A funnel step that leaks. "Users reach the shipping form but do not reach payment."
- A goal that underperforms. "Trial signups from the pricing page dropped this week."
- A support signal. "Three tickets mention the address field this month."
- A release you want to verify. "Did the new checkout change behavior?"
Each question defines a segment. Watch sessions from that segment, not the general firehose.
Pick a sample you can actually defend
You cannot watch every session, and you should not try. The goal is a small set that represents the behavior you are investigating.
A workable sample for one question is roughly 10 to 20 sessions, selected deliberately rather than by recency:
- Filter to the segment. Sessions that entered the funnel step or triggered the goal, inside a defined date range.
- Mix outcomes. Include sessions that failed, sessions that succeeded, and a few that look ambiguous. Watching only failures teaches you nothing about what normal looks like.
- Spread the surface. Cover the main device types, browsers, and entry points, because a bug on mobile Safari is invisible if every session you watch is desktop Chrome.
- Prefer frustration signals. If the tool ranks sessions by rage clicks, errors, or dead clicks, start there, then add a control group of clean sessions.
Write down the filter you used. A finding is only as credible as the sample behind it, and "I watched some recordings" is not a sample.

Read each session for signals, not entertainment
When you watch a single recording, you are looking for a small set of behaviors that reliably indicate friction. Ignore routine mouse movement and scrolling. Pause on the following.
| Signal | What it usually means | What to capture |
|---|---|---|
| Rage clicks | Repeated fast clicks on one element; the user expects a response and gets none | The element, the page, what happened just before |
| Dead clicks | A click on something that looks interactive but does nothing | Which element looked clickable and why |
| Error clicks | A click that triggers a visible or console error | The error text and the step it broke |
| Form abandonment | Focus enters a field, then the user hesitates, retries, or leaves | The exact field and any validation shown |
| Loops and backtracking | The user repeats a step or returns to a previous screen | The step being repeated and the apparent goal |
| Drop-off point | The last meaningful action before the session ends | Where it happened relative to the funnel |
Rage clicks and dead clicks are common vocabulary across replay tools for a reason: they mark the moments where intent met a wall. Fullstory, for example, logs a rage click when a user clicks rapidly in the same area, and treats dead clicks and error clicks as related frustration signals. Whatever tool you use, these are the moments worth a timestamp.
For each session, note the user's apparent goal, the critical sequence, the friction, and the outcome. Resist inventing motivation. A recording can show someone opened pricing three times; it cannot prove they thought the product was expensive unless they said so.
Move from one recording to a pattern
One session is an anecdote. The analysis that matters happens when you notice the same behavior across the sample.
After watching your 10 to 20 sessions, group what you saw:

Flowsery
Start Your 14-Day Free Trial
Real-time dashboard
Goal tracking
Cookie-free tracking
- Cluster by cause, not by symptom. Five users who abandoned checkout may have five different reasons. Separate the ones who hit a broken address field from the ones who left to compare prices.
- Count the affected sessions. "Seven of nineteen failed at the same validation" is a finding. "A user seemed confused" is not.
- Tie the cluster to a step. Connect the behavior to a specific funnel stage or goal so its impact is measurable.
- Keep the evidence. For each cluster, hold two or three representative timestamps so anyone can verify the claim by watching.
The output of this stage is one sentence per pattern, each backed by a count and links:
Address autocomplete failed after country selection in 8 of 19 sessions, concentrated on mobile Safari. Six of those eight left before reaching payment.
That statement is compressed, but the original behavior is still inspectable. That is the difference between a summary and a guess.
Where AI compresses the work, and where it does not
Watching sessions is slow, and most of what you watch is routine. This is where automated analysis earns its place.
Used well, AI narrows the pile before you spend human attention:
- It summarizes a single session into a timeline so you decide in seconds whether to watch it.
- It surfaces candidate sessions by frustration signal or by similarity to a session you flagged.
- It clusters repeated behavior across many sessions so you are not doing the grouping by hand.
What AI does not remove is judgment. It can propose that 8 sessions share a behavior; you still confirm the cause, check the sample was fair, and decide whether the problem is worth an engineer's week. Treat a generated summary as a lead to verify, not a conclusion to ship. Ask any tool to link every claim back to the exact replay moment, and be skeptical of fluent prose that has no timestamp behind it.
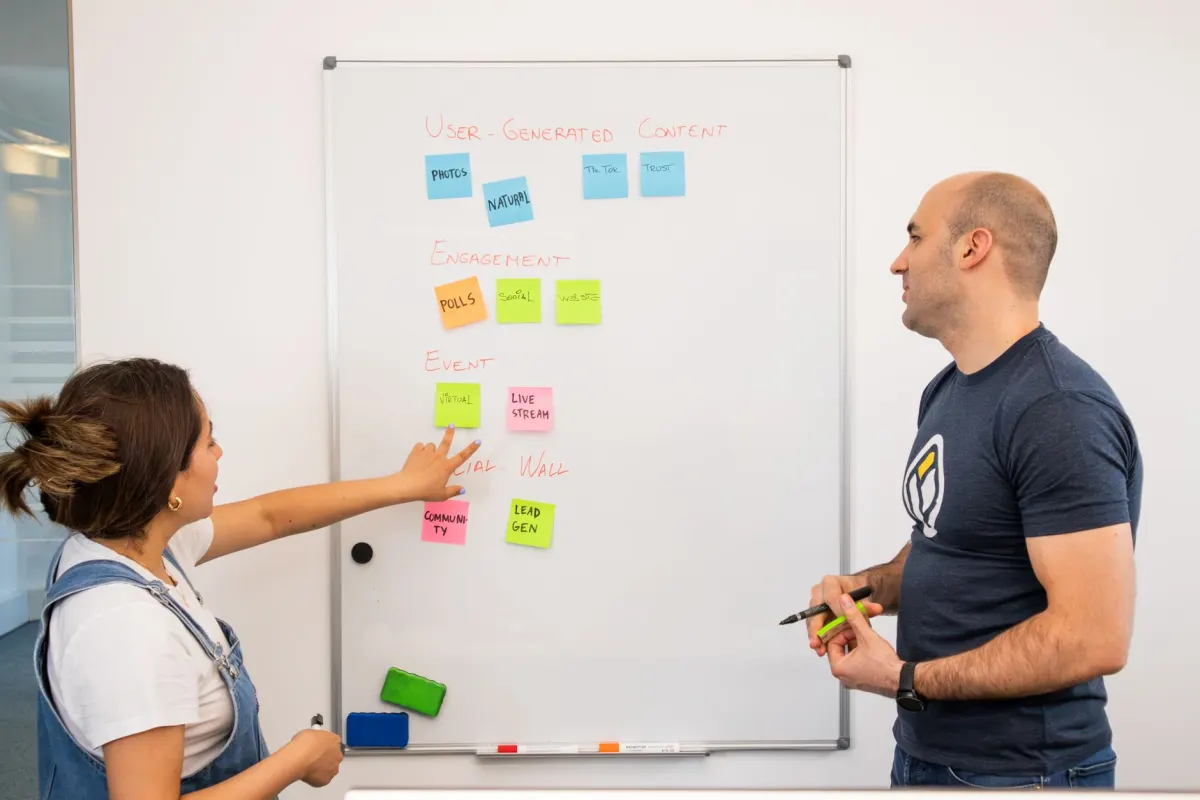
Turn findings into ranked issues
Analysis that ends in a document changes nothing. The last step converts each pattern into an issue the team can prioritize.
For every finding, record:
- The pattern, in one sentence.
- The affected step or goal, so impact is tied to the funnel.
- The reach, as a count or rate of affected sessions.
- The evidence, as replay links to representative moments.
- A severity guess, combining reach and how badly it blocks the goal.
Then rank. A bug that stops 30% of mobile checkouts outranks a confusing tooltip that annoys a handful of desktop users, even if the tooltip was more fun to watch. Sort by impact on the goal, hand the top items to the team with their evidence attached, and leave the rest documented for later.
Done this way, session recordings stop being a video library and become a queue of ranked, verifiable problems.
Frequently asked questions
How many session recordings should I watch?
Enough to represent the behavior in question, not enough to burn a day. For one funnel step or goal, 10 to 20 deliberately chosen sessions usually surface the repeated patterns. If new sessions stop teaching you anything, you have watched enough.
How do I choose which recordings to watch?
Filter to the segment tied to your question, then mix outcomes and devices. Prefer sessions flagged for rage clicks, errors, or dead clicks, but include a few clean and successful sessions so you know what normal looks like.
What signals matter most in a recording?
Frustration signals and drop-offs: rage clicks, dead clicks, error clicks, form hesitation, repeated steps, and the last action before a session ends. These mark where intent met friction. Routine scrolling and mouse movement can be ignored.
Can I trust an AI summary instead of watching?
Use it to triage and to cluster, then verify the high-impact or ambiguous findings by watching. A summary should link every claim to a replay moment; if it cannot, treat it as an unproven lead.
Flowsery
Start Your 14-Day Free Trial
Real-time dashboard
Goal tracking
Cookie-free tracking
How do I turn recordings into decisions?
Group repeated behavior into patterns, count the affected sessions, tie each pattern to a funnel step or goal, attach evidence links, and rank by impact. The result is a prioritized list of issues, not a pile of videos.
Turn session recordings into ranked issues with Flowsery - start free and review the sessions that actually move your funnel.
Sources: Fullstory: What are rage clicks and Fullstory frustration signals: rage, error, dead clicks. Checked July 24, 2026.
What should I write down for each session I watch?
For each session, write down the user's apparent goal, the critical sequence of actions, the friction point, and the outcome. Skip guesses about motivation. A recording can show someone opened the pricing page three times, but it cannot prove they thought the product was too expensive unless they said so.
Why include successful sessions in the sample, not just failures?
Watching only sessions that failed teaches you nothing about what normal behavior looks like on that funnel step. A workable sample mixes sessions that failed, sessions that succeeded, and a few that look ambiguous, so you can tell a real problem from ordinary variation. The same logic applies to devices and browsers. A bug on mobile Safari stays invisible if every session you watch is desktop Chrome.
What information belongs in a ranked issue?
Each issue needs the pattern in one sentence, the funnel step or goal it affects, and the reach as a count or rate of affected sessions. Evidence comes next: replay links to representative moments. Add a severity guess that combines reach with how badly the pattern blocks the goal. That combination is what lets a team rank a checkout bug above a tooltip complaint instead of debating from memory.
What is a rage click?
A rage click is a burst of repeated, fast clicks on the same element. It is the pattern replay tools use to flag a moment where a user expected a response and got none. Fullstory logs rage clicks this way and treats dead clicks and error clicks as related frustration signals. Note the element, the page, and what happened just before it.
How do I prioritize which findings to fix first?
Rank each finding by its impact on the goal, weighing reach against how badly it blocks the step. A bug that stops 30% of mobile checkouts outranks a confusing tooltip that only annoys a handful of desktop users, even if the tooltip was more interesting to watch. Hand the top items to the team with their evidence attached and leave the rest documented for later.
Was This Article Helpful?
Let us know what you think!
See us more often in Google
One click marks Flowsery as a preferred source, so our articles sit higher in your Top Stories, AI Mode, and AI Overviews.
Before you go...
Flowsery
Revenue-first analytics for your website
Track every visitor, source, and conversion in real time. Simple, powerful, and cookie-free.
Real-time dashboard
Goal tracking
Cookie-free tracking
Related Articles
Make Session Replay Summaries Useful Beyond One Recording
Learn when session replay summaries save time, where single-session recaps fall short, and how to turn many recordings into ranked product findings.
Turn Recordings Into AI Product Insights From Sessions
Weekly intelligence, friction monitoring and quantified impact: how raw replay data becomes AI product insights from sessions rather than one-off summaries.
How to Analyze PostHog Session Recordings for Repeatable Issues
Filters, collections and Max AI summaries all help you analyze PostHog session recordings, but here is exactly where the built-in workflow runs out.